
The 2018 Pause in “Real Bracket Creep”
As the House this week starts to consider “Tax Reform 2.0” that would among other provisions permanently extend the marginal rate cuts in the individual income tax passed under the Tax Cuts and Jobs Act (TCJA), it seems a good time to look at DEG’s real-time, daily-updated individual receipts chart a little more closely.
The versions of the charts shown on our website are in nominal terms. The cumulative, year-to-date individual receipts chart looks like this:
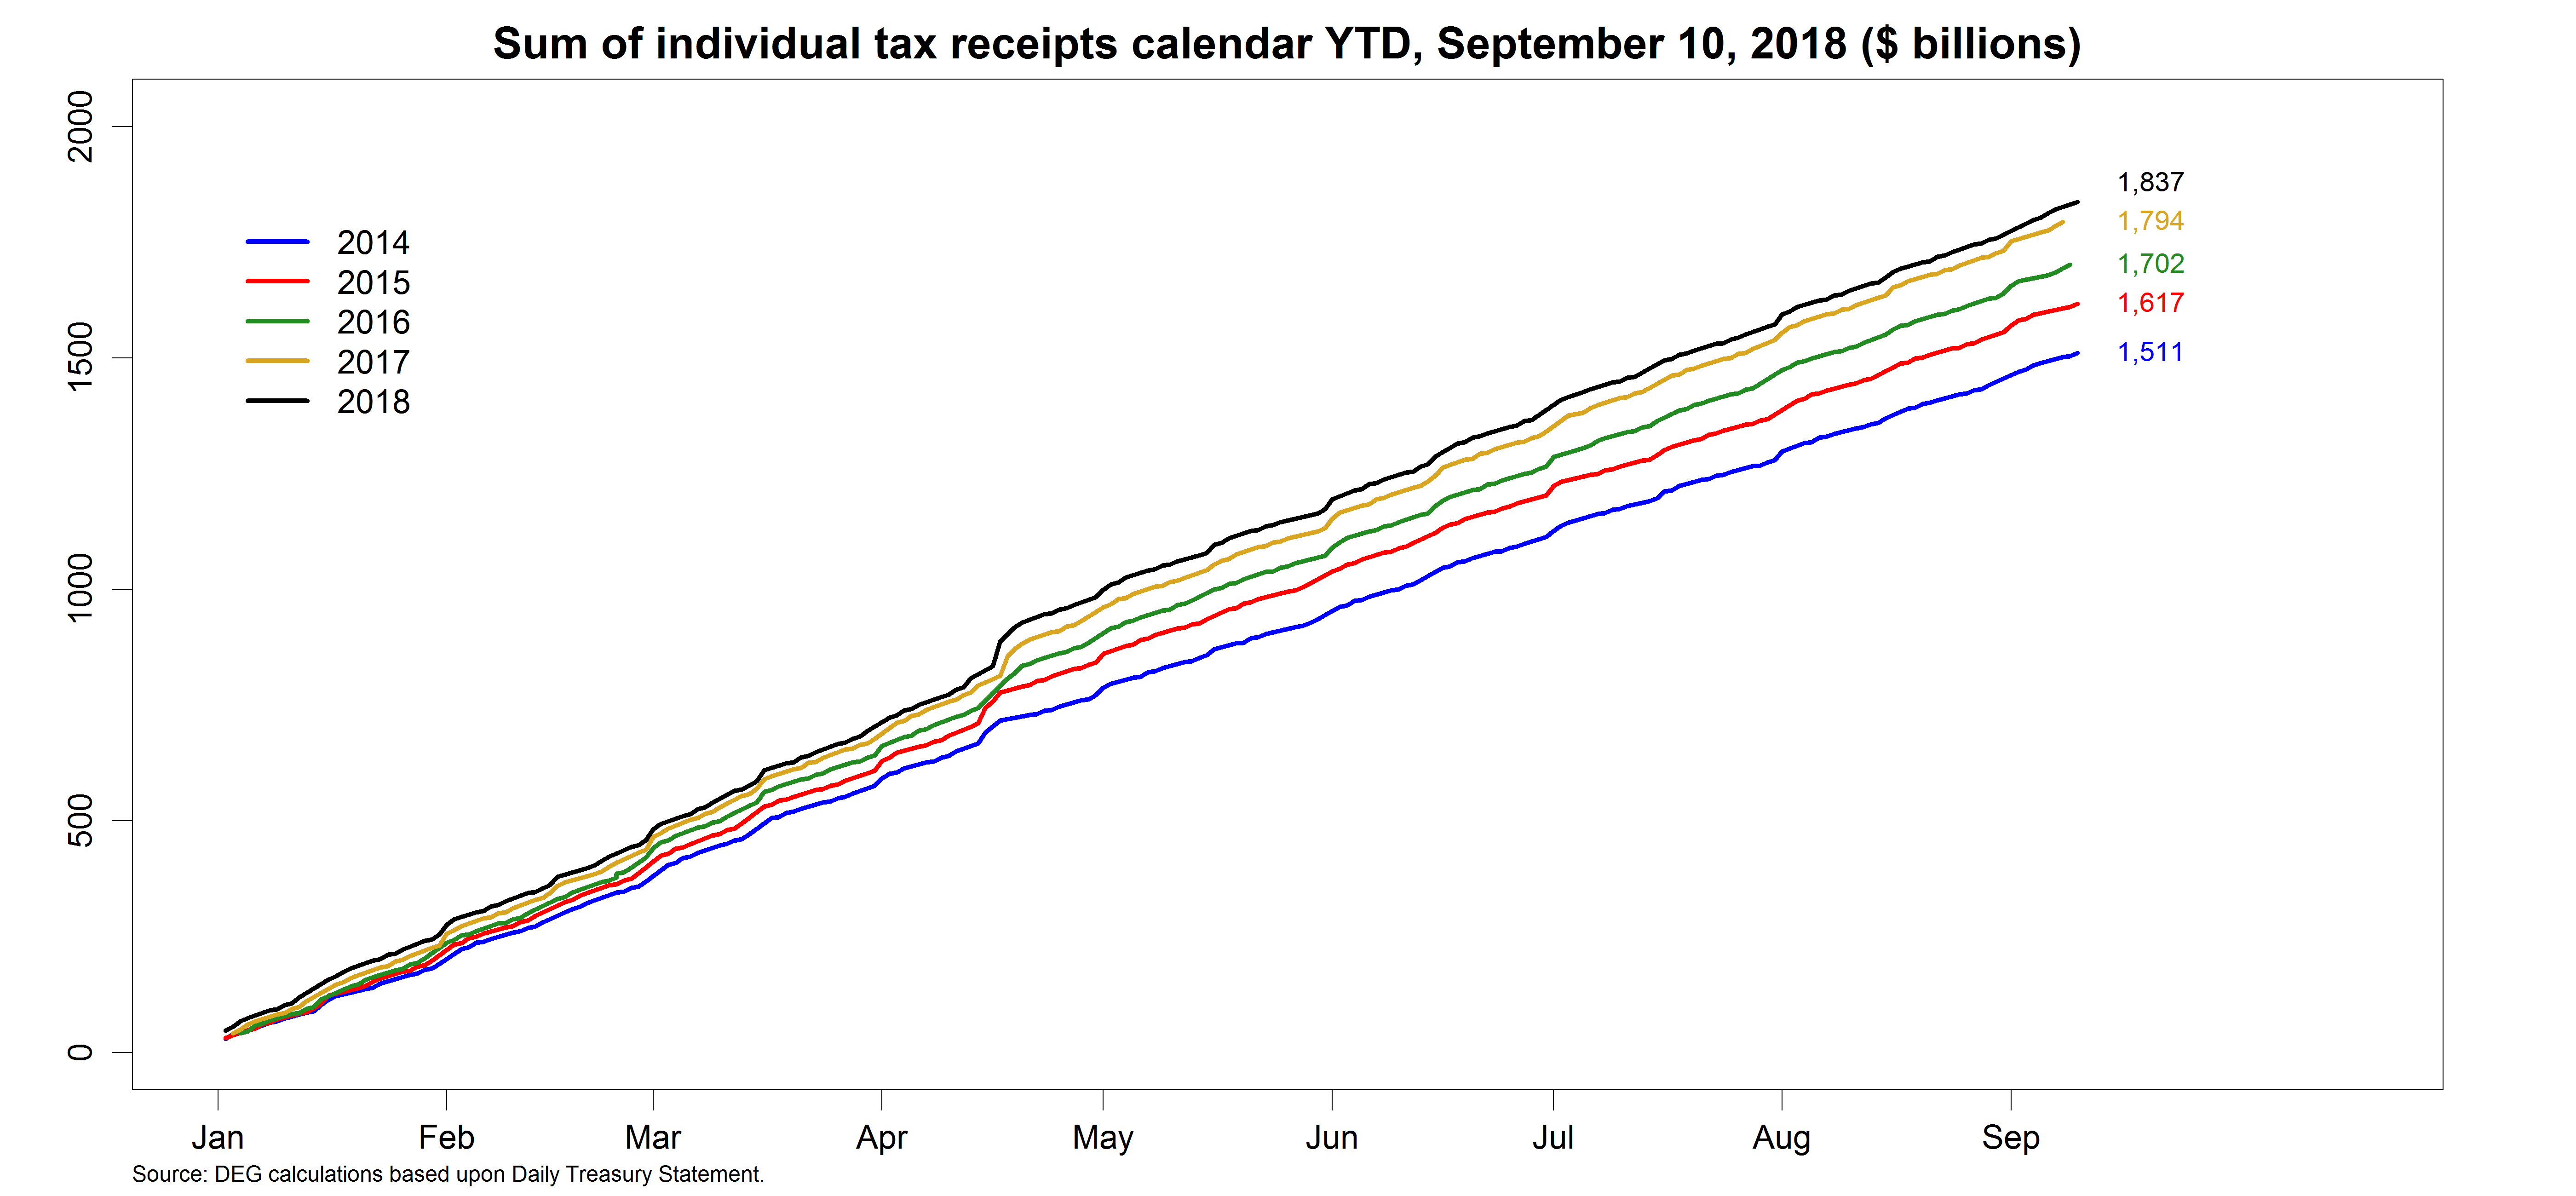
Note that each year’s receipts are higher than that of the previous year.
As of September 10th of this year, nominal individual payroll and income tax deposits are about $43 billion greater than last year ($1,837 – $1,794 = $43). But when we put the receipts in real terms (using the GDP deflator), the cumulative, year-to-date real individual receipts chart looks like this:
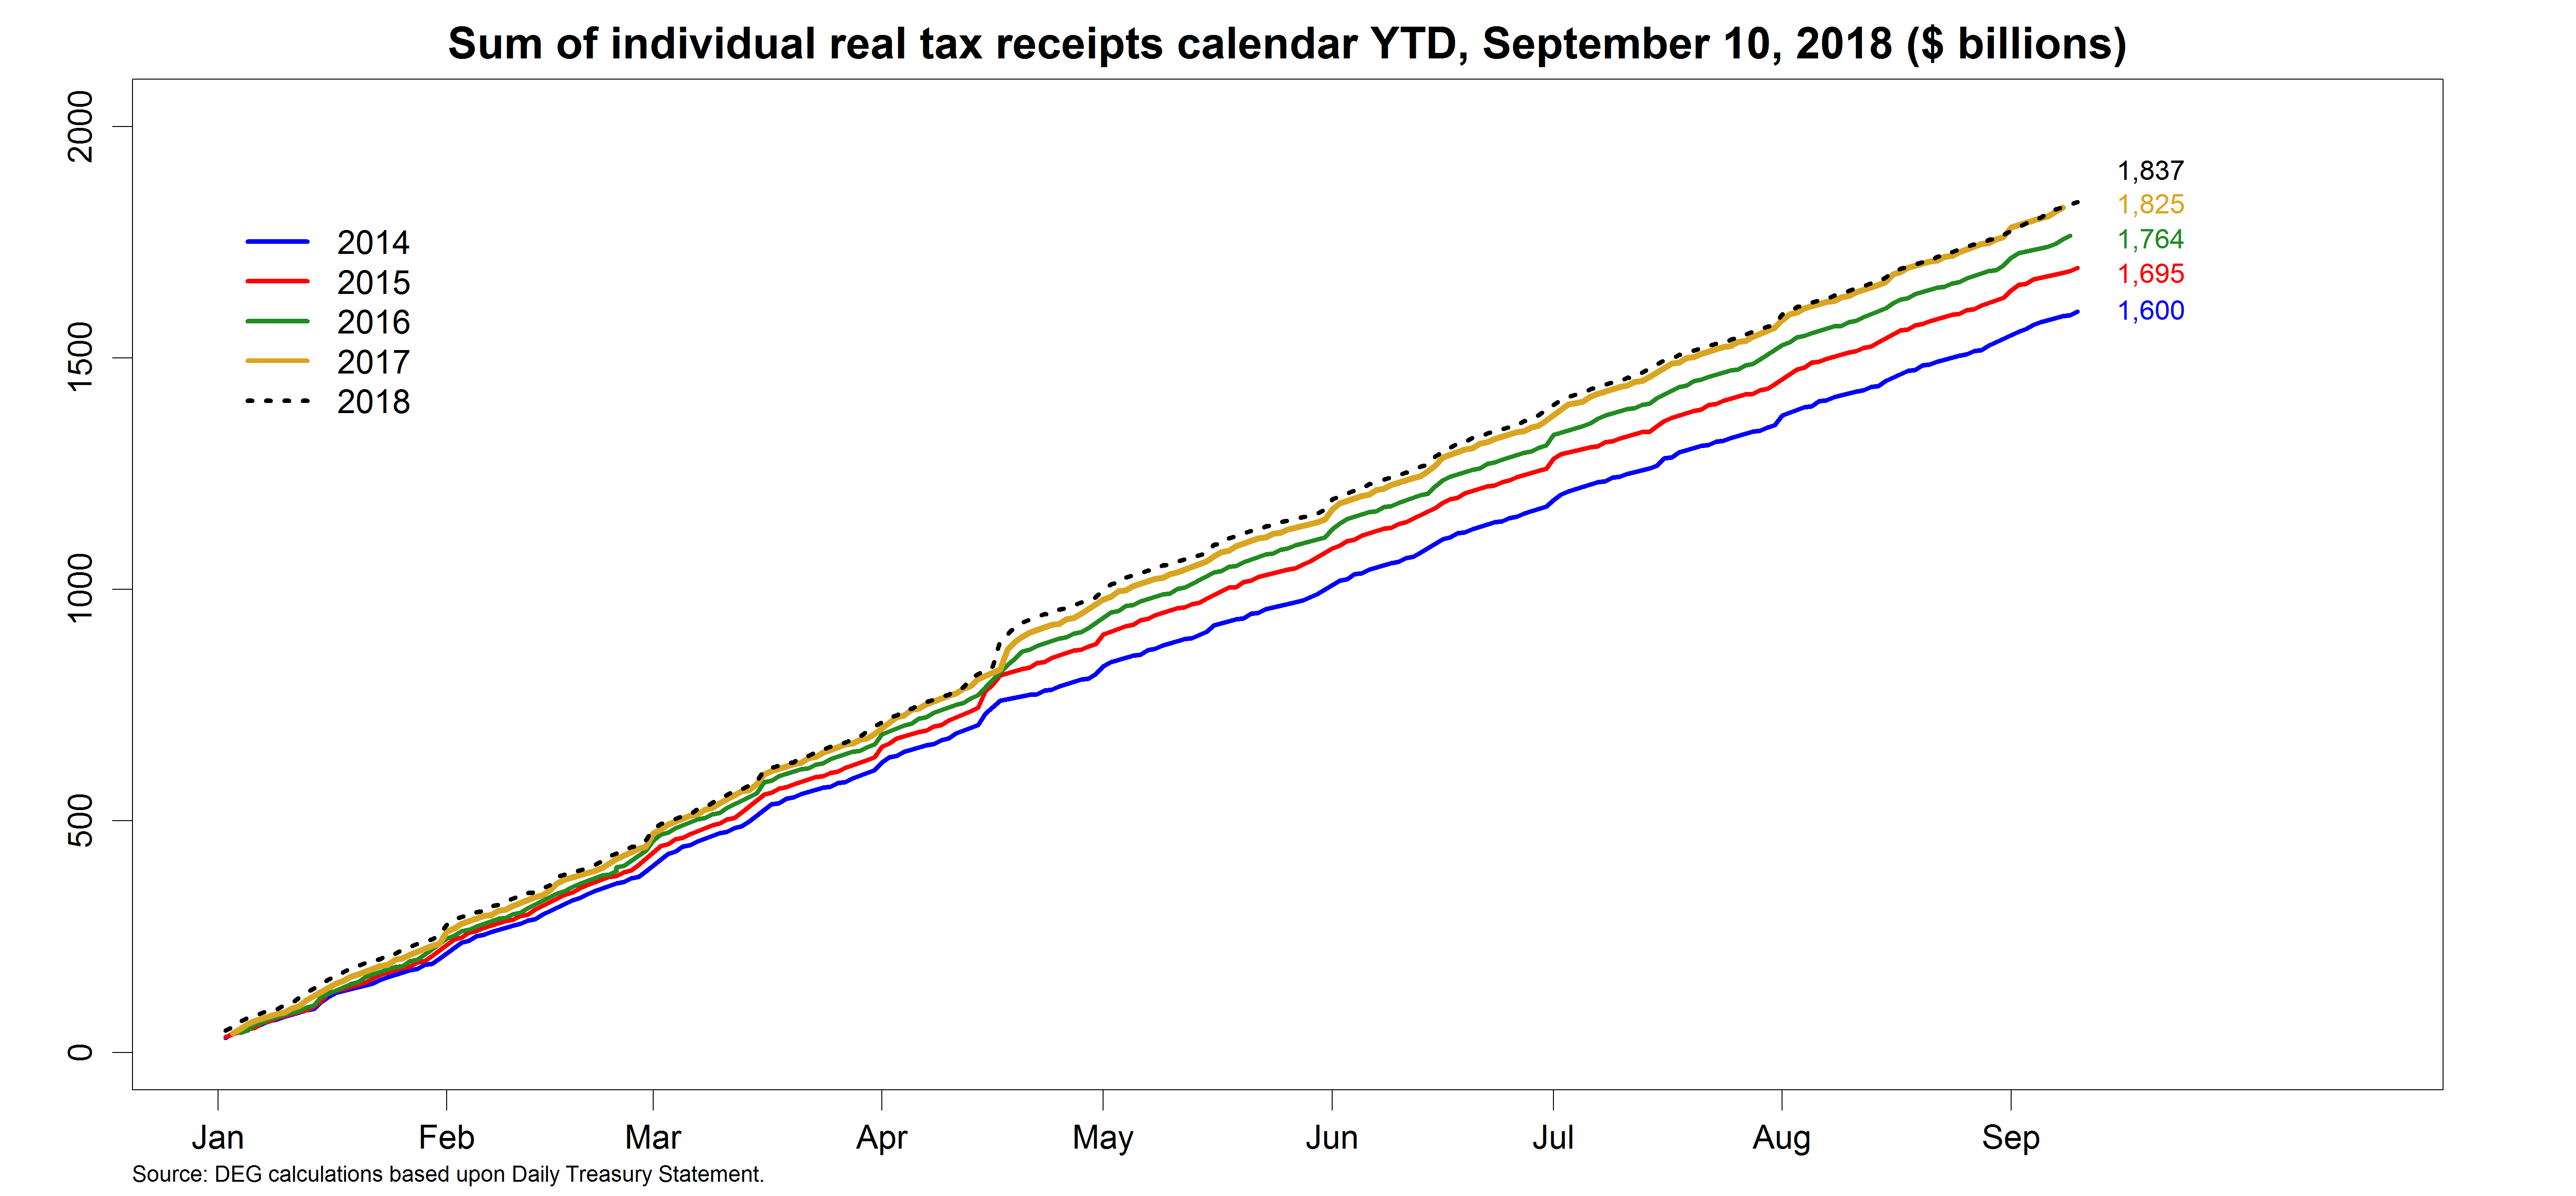
Note that in previous years, real individual receipts have risen just as nominal receipts have, compared with the prior year. But 2018 now stands out—or rather blends in (to 2017)—showing only a $12 billion increase compared with last year ($1,837 – $1,825).
In years where there have been no legislative changes to tax policy, the real chart reveals the phenomenon of what tax economists call “real bracket creep”—the growth in the real level of revenues and revenues/GDP that occurs because of our progressive income tax system and marginal tax rate brackets that are indexed to avoid the taxation of purely inflationary gains in income.
If people’s income rises by more than the rate of inflation, holding tax rates and the mix of sources of income constant, more of the individual income tax base ends up being taxed at higher marginal tax rates so that real individual tax receipts and revenue as a share of GDP grow.
As of September 10, 2018, real individual income tax receipts basically match its level at this time last year. So this year looks as if we’re not getting that real bracket creep, even as the macroeconomy and personal incomes are growing. Why not?
“We Had a Tax Cut, Stupid.” First, tax law has not held constant, because of legislative changes which were intended to reduce tax receipts:
- The Tax Cuts and Jobs Act (TCJA) passed in December 2017: 1) doubled the standard deduction, which for the majority of taxpayers who did not itemize deductions prior to the TCJA reduced their tax liability; and 2) reduced individual marginal income tax rates, including/especially at the highest levels of income (but also reduced itemized deductions for those who did itemize prior to TCJA although not sufficiently so to offset the rate reductions);
- These two changes alone may have offset any real taxable income growth and the effect of real bracket creep on receipts;
- If the legislative changes of the TCJA are the main factors for the absence of real bracket creep this year, then it should be a one-time, downward shift in the individual income and payroll tax receipts data and as we move forward, next year and the year after should return to more normal installments of real bracket creep (as tax rates are held constant but real incomes continue to grow).
The Economy Changes—It Doesn’t Just Grow. But this year’s suspension of/pause in real bracket creep might also be influenced by a variety of economic factors—how real income is growing and changing, and not just that (the level of) real income is growing. For example, are the shares of capital vs. labor income, the ways people earn their labor income, and the overall distribution and inequality of income across households changing?
Change in sources of income. If more personal income (particularly of higher-income, higher-bracket households) is now in the form of lower-taxed capital income rather than labor income, this would dampen real receipts growth even as real total income grows (as the effective tax rate on total income then falls).
There are at least three reasons that the mix of incomes realized by individuals could be changing this year in a manner that could reduce tax receipts:
- First, often in later stages of economic business cycles taxpayers realize increasingly larger amounts of capital gains income subject to tax at lower tax rates;
- Second, it is widely believed that one of the uses of repatriated income under the TCJA changes to tax code Section 965 beginning in 2018 would be increased stock buybacks, and this would also increase the proportion of individual income subject to lower capital gains tax rates;
- A third factor that could influence the mix of taxable sources of income, even within earned/labor income, is the evolving nature of work facilitated by the rapid expansion of electronic platform companies such as Uber, Lyft, and Airbnb. Most electronic platform companies treat persons providing services as independent contractors, but due to a special safe-harbor under Section 6050W do not provide a Form 1099 reporting amounts earned. In other words, as the mix of workers moves away from traditional employment and towards independent contractors who do not receive information reports, the tax system registers fewer tax payments even as employment statistics data show more persons working.
Change in the income distribution. Individual receipts grow fastest when real income growth is particularly strong at the highest parts of the income distribution (where income is subject to the highest marginal tax rates). If income inequality at the top of the income distribution is not growing as fast this year as in prior years, this would imply less real bracket creep than in prior years. Note, however, that the latest Census report released just yesterday (September 12) on income and poverty measures for last year (2017) indicates that inequality under various statistical measures did not change from 2016 to 2017.
What Would CBO Do? Considering and separating the legislative from economic factors affecting revenue levels is something the Congressional Budget Office does regularly and continually as it updates their budget outlook using revenue estimates combined with their macroeconomic models. In their latest outlook report published in April 2018 (see Appendix A), the CBO had estimated that legislative factors (-$1.1 trillion, from the TCJA passed in December 2017) far outweighed economic factors (+$468 billion) in their downward-revised projections for individual income tax revenues over the ten-year budget window. The cumulative receipts chart that DEG keeps track of simply reveals this change in outlook playing out in real time.
- Paper on U.S. Sales Factor Apportionment (2014)
- Seeing (More of) the Gig Economy and Platform Workers in Tax Return Data