
Seeing (More of) the Gig Economy and Platform Workers in Tax Return Data
Watch DEG comment on the size and scope of the gig economy at a Brookings Event on October 23, 2018 here: https://www.brookings.edu/events/taxing-the-gig-economy/
The Bureau of Labor Statistics (BLS) came out with its long-awaited “Contingent and Alternative Employment Arrangements” survey results in June of this year; the survey had been conducted in May 2017. The last time BLS conducted this survey was in 2005. The new results were surprising: neither “contingent” (work viewed as temporary) nor “alternative” (work viewed as outside the traditional employer-employee relationship) arrangements had increased—in fact the number of individuals who fell in these broad categories of “gig”-like work arrangements actually declined in the BLS survey. This seemed totally at odds with the apparent growth in the “gig economy” as we’ve perceived it in our everyday lives. Think of all that has happened since 2005 in terms of opportunities to hire and provide services via online interfaces (or “platforms”). Home rental companies HomeAway and Airbnb launched in 2006 and 2008, respectively. Errand and handyman service companies TaskRabbit (originally RunMyErrand) and Thumbtack were founded in 2008 and 2009. And the largest, most visible of the online labor platforms, ride-sharing companies Uber and Lyft, weren’t around until 2009 and 2012. Why was the BLS data not picking up what must have been significant growth in these new forms of work?
One reason jumps out right away, tied to what the BLS survey asks of the individual respondent. They ask about the nature of the respondent’s sole or “main” job—the job they spend the most hours per week doing. While the BLS regularly tracks how many people hold multiple jobs, in the contingent and alternative work arrangements survey, they did not ask about whether any of the job holder’s additional work qualified as contingent or alternative.
Here is where we realized that tax return data can tell us something about the labor market that even the official employment data cannot. In principle, all taxable income should be reported on one’s tax return. Tabulations provided by the Internal Revenue Service’s Statistics of Income (SOI) revealed close alignment between the numbers from BLS’s contingent and alternative arrangements survey and the numbers of persons reporting self-employment income as their only source of earned income on their tax return, as shown in the two right-most columns below:
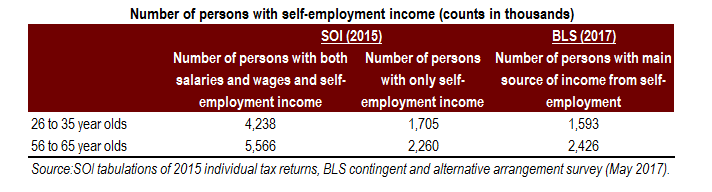
Note that there were around 1.7 million 26 to 35 year olds and 2.3 million 56 to 65 year olds with only self-employment income in the 2015 SOI data, numbers similar to the 2017 BLS counts of “independent contractor”/self-employed workers for the same age categories in the last column. (BLS’s definition of “independent contractor” is actually broader than the tax definition, because it: (i) includes some persons who are wage and salary workers, not just the self-employed; and (ii) includes both filers and non-filers of tax returns.) So, the BLS data seem to be capturing the population of self-employed tax filers whose only source of earned income is self-employment. But the people who have a mix of employee and independent work in the SOI data (4.2 million and 5.6 million for the younger and older cohorts, respectively) far outnumber the “only job is self-employment” people. Given the apparent consistency between the “only”-job-is-self-employment numbers in the SOI data and the “main”-job-is-self-employment numbers in the BLS data, this implies there aren’t many workers who have both employee and independent earnings where their self-employment would be considered their “main” job (under the BLS definition).
Having established some consistency between the recent SOI and BLS self-employment/independent contractor counts while uncovering the larger share of self-employment activity in the mixed-sources-of-earned-income group, we looked at trends in the SOI data over the past 20 years in reported self-employment income.
Were 26 to 35 year olds in the labor force in 2015, with all of the growth in online platform opportunities, any more likely to be self-employed than 26 to 35 year olds in 1995? We asked the same question about older, more experienced workers.
As the chart below shows, self-employment as a primary means of work increased by nearly 60 percent (from 2.9% to 4.6%) for the 26 to 35 year olds, while remaining essentially flat for the 56 to 65 year olds over the same period.
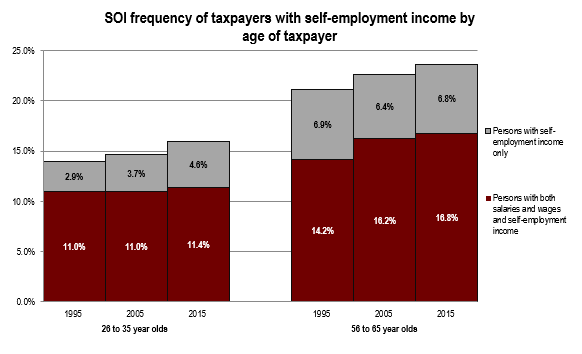
Additionally, we see from the tax return data that the overall share of taxpayers with self-employment income has risen over time, with the trend driven more by growth in the self-employment-only category among younger workers, and driven more by growth in the mixed-sources category among older workers.
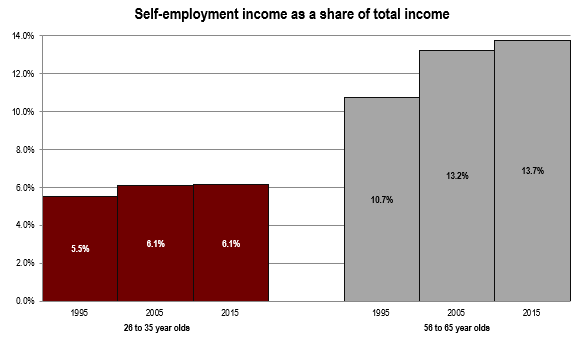
The next chart shows that as a source of income, self-employment income contributes a larger and growing share of income for older workers, compared with a smaller and leveled share of income for younger workers:
And the contrast between younger and older self-employment income in real dollar terms is even starker:

Yes, self-employment appears to reward older workers much more, both from a share of income and amount of income perspective. This is consistent with the idea that older workers are more likely to use self-employment as a way of monetizing their accumulated human capital to supplement their income. In contrast, it might be more typical of younger workers to take an alternative work arrangement as the best main job they can find or look for extra “gig” work for much-needed supplemental income. Unlike their older peers, they are unable to command any value from accumulated human capital that they do not yet have. The per-capita income chart above appears to support this interpretation.
We’ve shown here how some relatively simple tabulations of tax return data can tell us things about employment arrangements that even the official labor statistics cannot. A much more intricate analysis by Abraham et al. (2018) that matched specific individuals in the household survey to the tax return data (contained within social security earnings data) has shown the same—that the size and growth of the “gig economy” is bigger than the BLS survey shows. But the fact is that even these tax return data, focused on individual income taxes, show us but a small fraction of “gig work” that’s actually out there, because most of the online platform payments that go to individuals never show up on an individual income tax return! One reason is that most lower-income individuals fall under the exemption level of the income and hence do not file income tax returns. And a second reason is that the online services platform companies who pay their providers electronically—the Ubers, TaskRabbits, Airbnbs, etc.—are only required to provide information reports (Form 1099-Ks) to individual workers if they have received gross payments of more than $20,000 over the year and have had more than 200 transactions. A 2017 analysis by Earnest of loan applications found that 85 percent of gig workers make less than $500 per month (or $6,000 per year). Thus, it is likely that the vast majority of people who provide these gig services are not receiving information from the platform company on the payments they received over the year. This means even the tax return data aren’t “seeing” all the people or the income that’s in this alternative work arrangements space.
This leads us to conclude that researchers ought to continue to pursue multiple strategies in studying the “gig economy”—such as tracking the payment flows which fly largely under the tax radar, as the JP Morgan-Chase Institute has been doing with their own data on consumer bank accounts (their most recent analysis here). But there is still another tax-return “hood” to look under, to find more of the “gig economy”—and that’s on the corporate side. Because payments to platform workers are a major expense for these companies, these payments will be deducted on their tax returns. But only a portion of the gross payments deducted by the platform companies on their tax returns ever show up as revenues on individual income tax returns. And unlike the traditional wage and salary reporting system, there’s no analogous reporting for the number of persons providing services through these platform businesses.