
2018 Was an Unusual Year for Tax Receipts
In mid-September we noted that our regular tracking of cumulative, year-to-date daily Treasury tax receipts showed an apparent “pause” in the usual phenomenon of “real bracket creep”—which is the growth in (real and not just nominal) tax receipts that happens as incomes rise by more than inflation. Now that 2018 is fully behind us, we can report that real bracket creep did not just “pause” but turned into a real “sag.”
Our daily tax receipts page always shows current-dollar or nominal values. Adjusting individual tax receipts (which come from both income and payroll taxes) for inflation (according to the GDP deflator), here is the chart of real individual tax receipts through the end of calendar year 2018 (black dotted line) compared with previous calendar years:
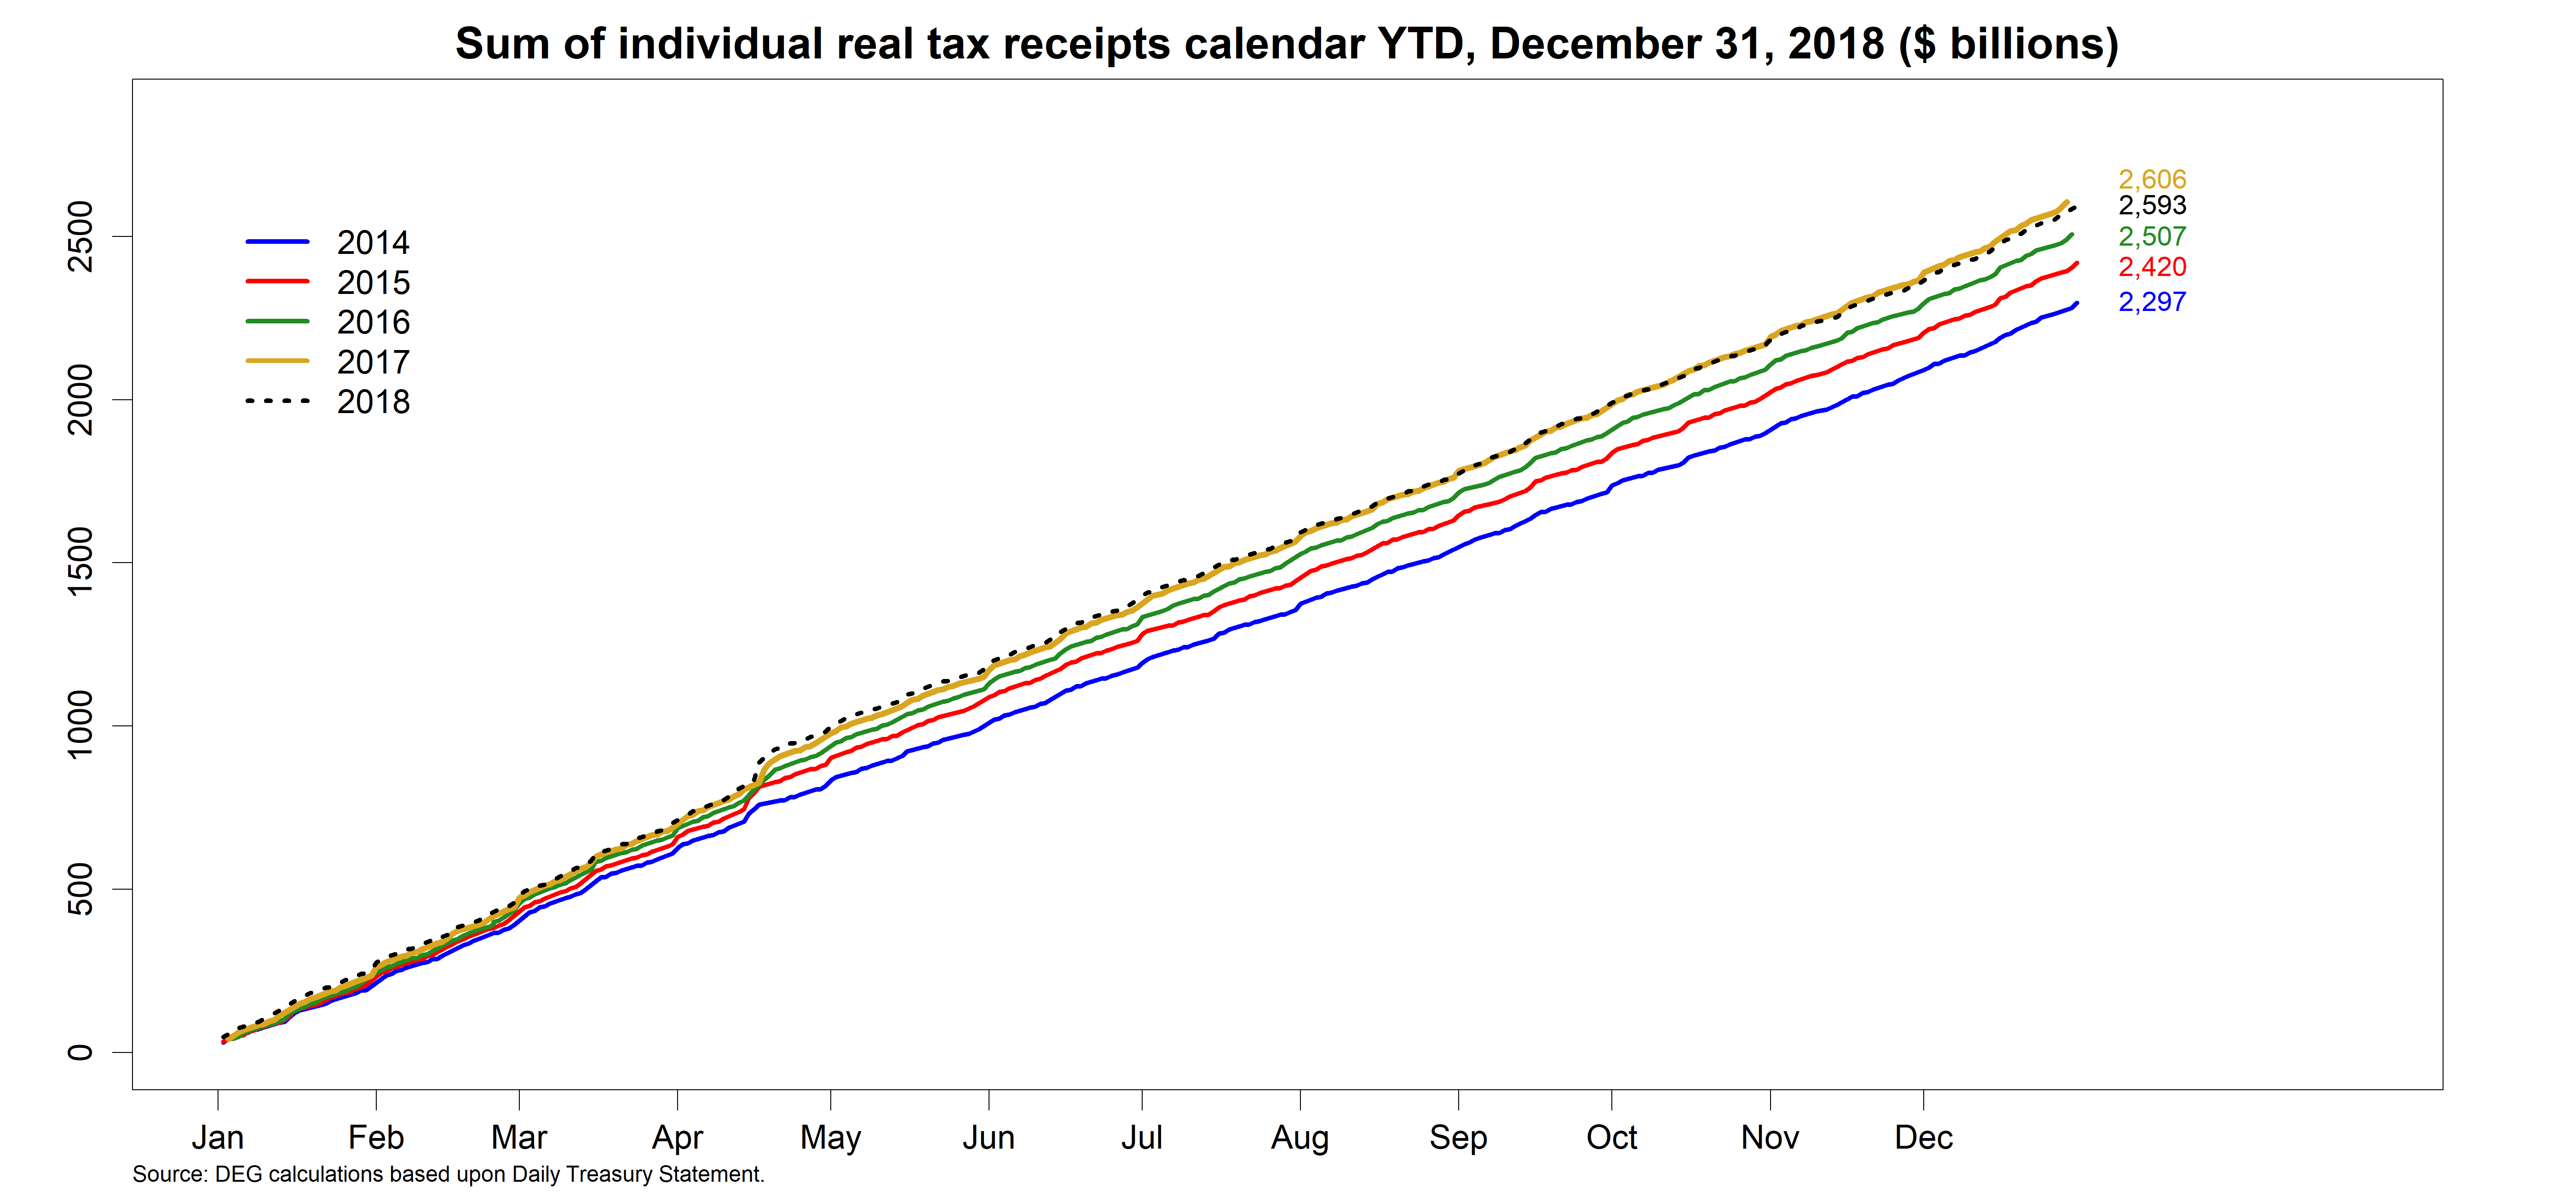
Over the four prior years, 2014-17, we saw steady growth in real receipts compared with each immediately preceding year, reflecting real growth in incomes. In 2018, the growth in real individual receipts started to fade by late summer, and by October 31st the prior year took a consistent lead. (Zoom into the chart to better see this tight contest.)
As of December 31, the final business day of calendar year 2018, the Treasury had received $2.593 trillion in individual tax receipts, falling a half of one percent short of the real level of receipts collected in 2017. (In nominal terms individual receipts were up in 2018 by about 1 percent.) In their latest budget and economic outlook (April 2018) the Congressional Budget Office (CBO) expected that nominal individual tax receipts would rise in fiscal year 2018 (October 2017 through September 2018) by 3 percent—not as fast as the expected growth in the overall economy, but still faster than inflation. (Thus, revenues as a share of GDP were projected to fall but real income tax receipts would still rise.) The CBO revenue chapter explains this projection as resulting from a combination of the changes in tax law (namely, the Tax Cuts and Jobs Act provisions effective starting January 2018) which reduce revenues, and economic factors which were expected to increase revenues (in particular “the expectation of strong growth in realizations of capital gains following rising values in the stock market over the past year” (pg. 65)). Given the fiscal versus calendar year accounting, the (negative) legislative factor plays bigger in our calendar-year-end cumulative receipts measure than in the CBO projection, and the expected positive economic factors have played smaller (one immediately obvious reason being the decline in the stock market over the last two months of 2018).
What about corporate tax receipts? As expected, corporate receipts were down whether considered in nominal or real terms. Either way you look at it, corporate receipts in calendar year 2018 were “more than a quarter short”—measured in time or money—of where they were in 2017. Nominal corporate receipts (shown on our tax receipts page) as of December 31 were $84 billion (or 26 percent) below where they were at the end of 2017. The inflation-adjusted (real) corporate receipts chart looks like this—showing an $89 billion (or 28 percent) drop compared with 2017:
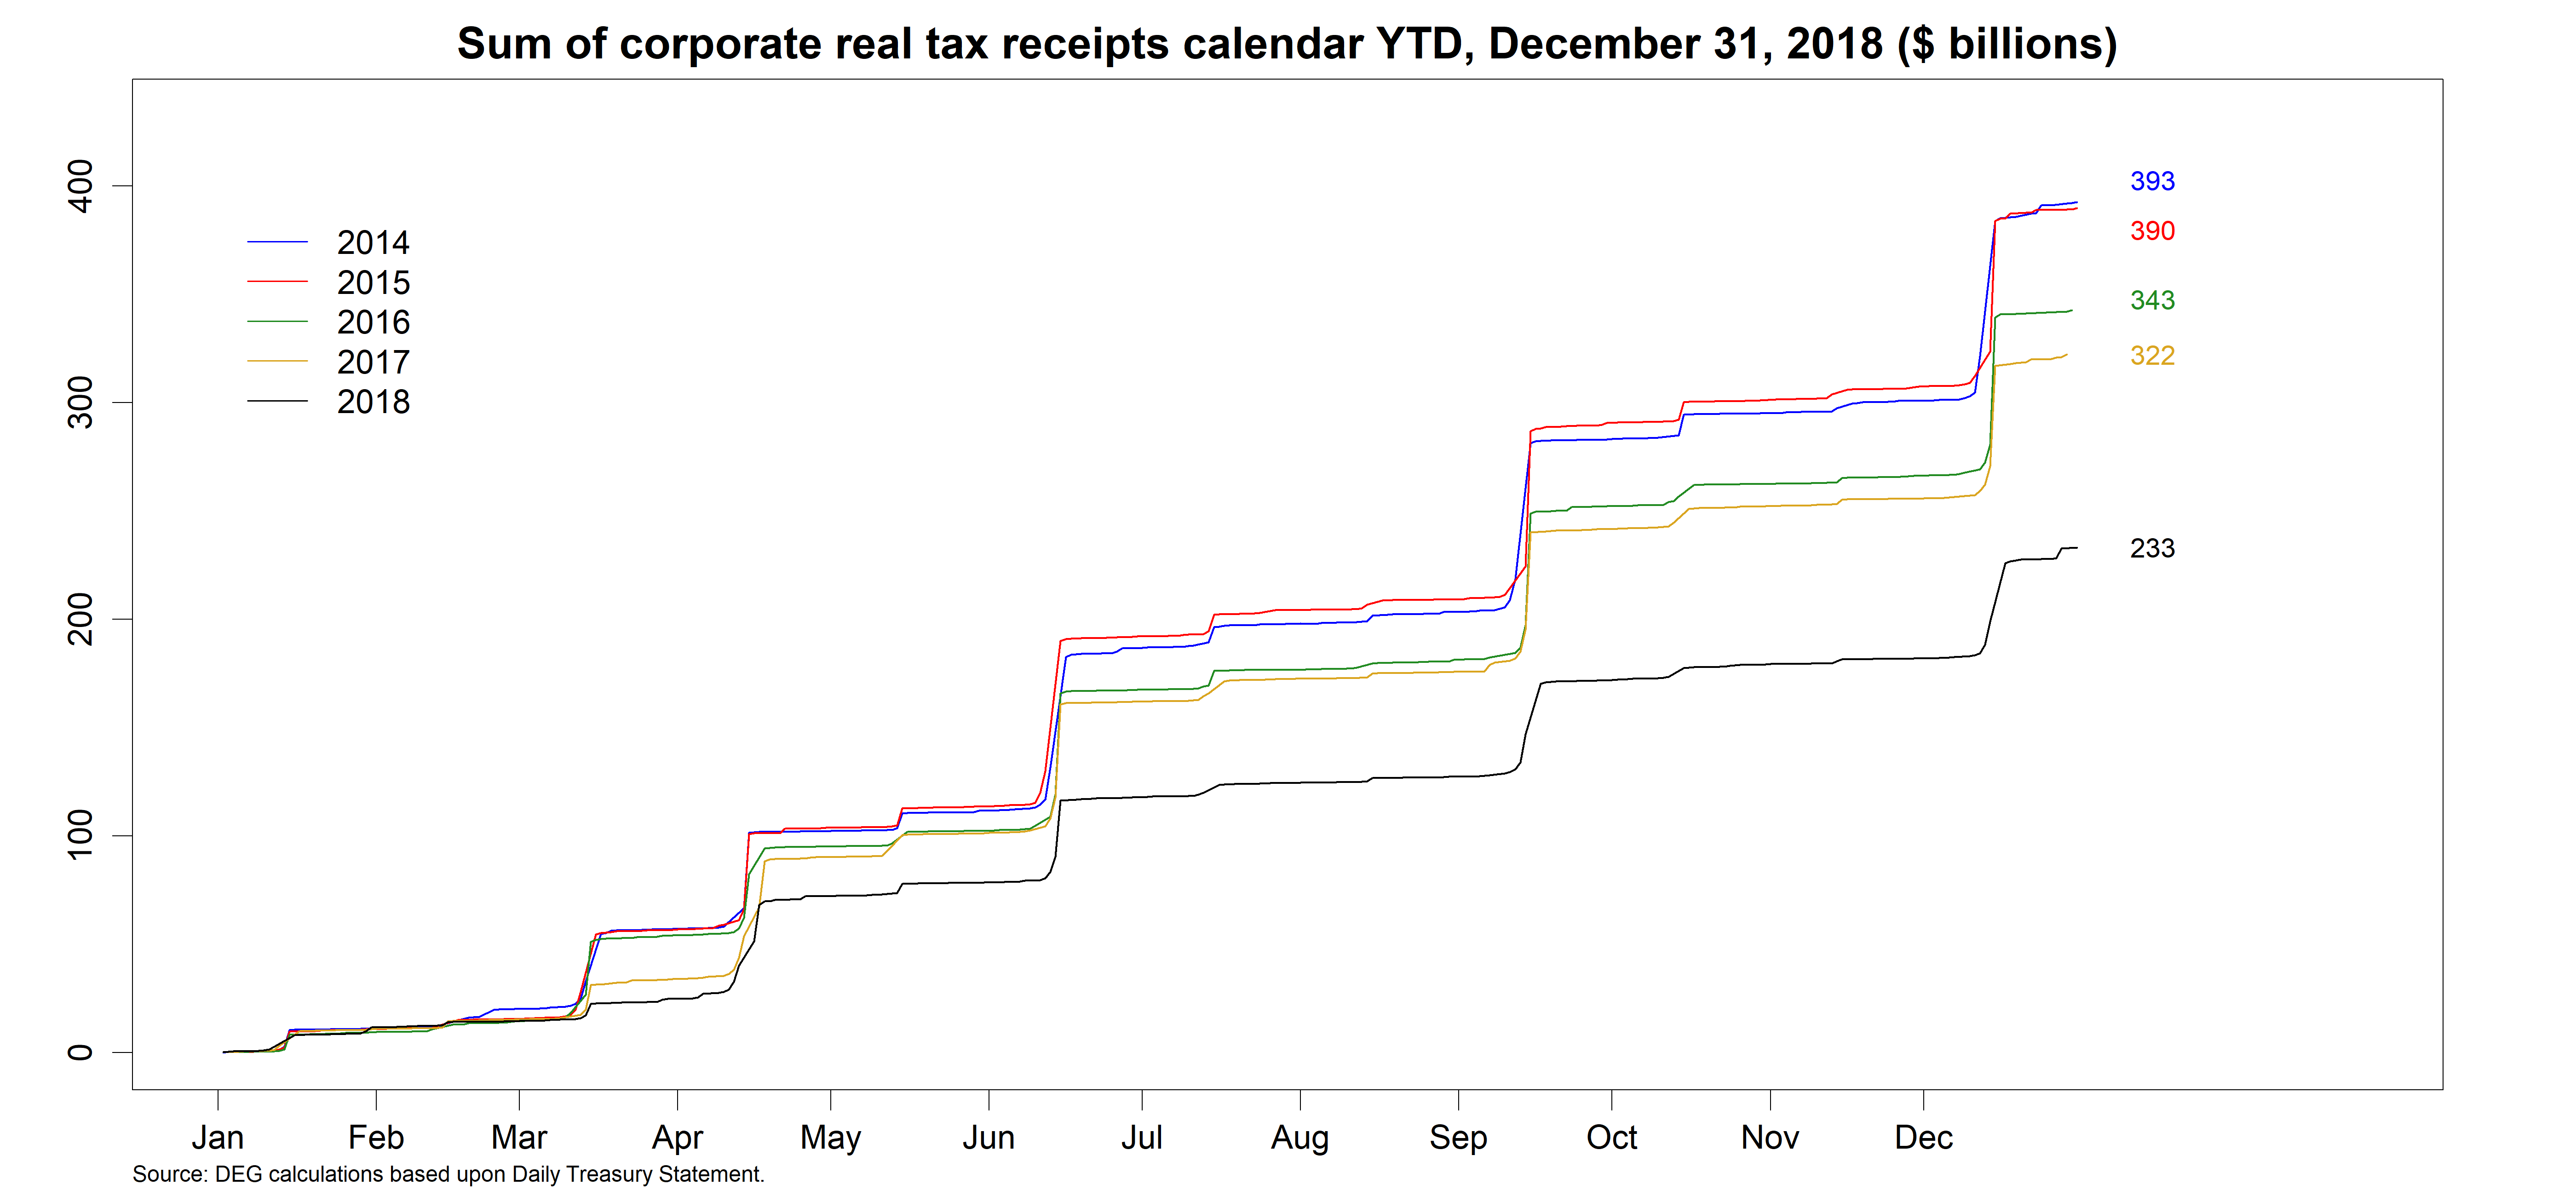
In either real or nominal terms, cumulative corporate tax receipts had reached the 2018 end-of-year level by September 15th of 2017 (3 ½ months earlier).
It is too early for anyone to know (or even provide an adequately-informed guess on) how much of the apparent (and to at least some extent unexpected) “sag” in revenues can be attributed to a costlier-than-expected tax cut versus a weaker-than-expected (yet still expansionary) economy. But it is clear that tax revenues are not as strong as in previous years, despite the economy being in good shape and still growing. Given the April 2018 CBO outlook of slowing economic growth and rising budget deficits through 2020, the real revenue “sag” of 2018 that CBO did not predict may presage even larger deficits than previously forecasted.